




- Published on: 2026-07-28 12:53:00
Stop Guessing the Market! Here's How to Read Candlestick Patterns Correctly

When you first open a trading platform, the screen filled with green and red blocks can look incredibly confusing. It is completely normal for beginners to wonder, what are candlesticks?
Many new traders ignore the importance of reading these patterns and jump into the market based purely on gut feeling. However, if you take a little time to learn how to read candlestick charts, you are essentially learning the secret language of the market. Each candle tells a story. It tells you who is winning the battle: the buyers or the sellers.
Think of each candle as a summary of the fight within a specific time period. Its function is to give you complete information: the opening price, the closing price, the highest price, and the lowest price.
Let us dive into this guide on candlestick trading for beginners from scratch, so you can perform your own candlestick analysis with much more confidence.
The Anatomy of a Candlestick: Body and Wicks
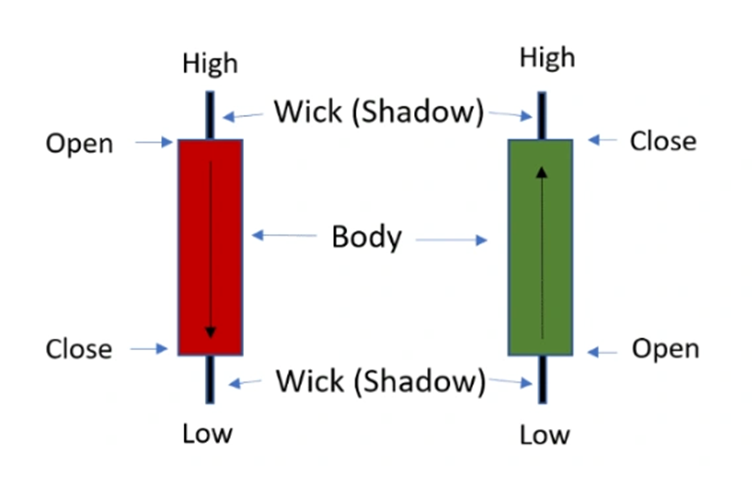
Before we get into the patterns, you must understand the parts of a single candle. Each candlestick has two main components:
- The Body: The thick, rectangular part that shows the difference between the opening and closing price.
- The Wick (or Shadow): The thin lines above and below the body that show the highest and lowest prices reached during that period.
Reading the body is simple: if it is green, it means the closing price was higher than the opening price (buyers won). If it is red, the closing price was lower (sellers won). It is that easy!
Spotting Bullish Signals (Signs of an Uptrend)
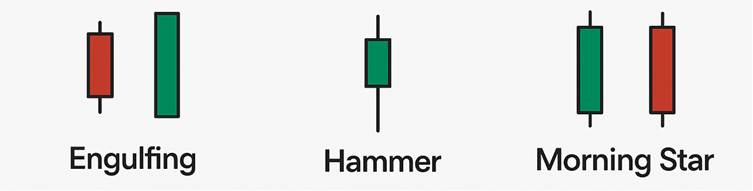
Seeing a bullish candlestick pattern is like getting a green light in the market. It signals that buyers are starting to take control. Here are a few of the most common ones:
- The Mighty Hammer: Imagine the market has been falling continuously, and then suddenly, a candle appears with a small body at the top and a very long lower wick. This is the hammer candlestick. That long tail tells the story of buyers fighting back and pushing the price up. It is a classic bullish signal that the market bottom might have been found.
- The Bullish Engulfing Pattern: This occurs when a large green candle completely "swallows" the body of the previous red candle. It is a clear sign that the sellers' momentum has been completely overwhelmed by the buyers.
- The Morning Star: This powerful three-candle pattern signals that a new dawn is coming after a dark downtrend. It starts with a large red candle, followed by a small, indecisive candle (like a Doji), and is completed by a large green candle. The Morning Star candlestick visually represents hope returning to the market.
Recognizing Bearish Signals (Signs of a Downtrend)
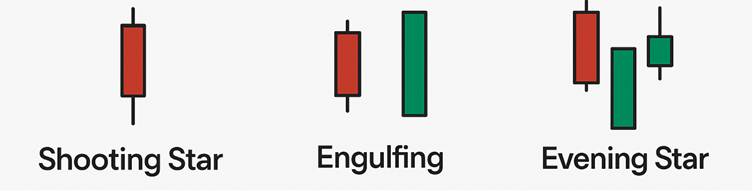
Conversely, when you see a bearish candlestick pattern, it is time to be cautious. Sellers might be about to take over the game.
- The Shooting Star: The opposite of a Hammer. It has a small body at the bottom with a very long upper wick. This long wick tells the story of buyers trying to push the price as high as possible but failing, as they were met with strong selling pressure from above. Look out for the shooting star candlestick after a strong uptrend.
- The Bearish Engulfing Pattern: This happens when a massive red candle completely engulfs the body of the previous green candle. It is a very powerful sell signal.
The Most Accurate Candlestick Reversal Patterns
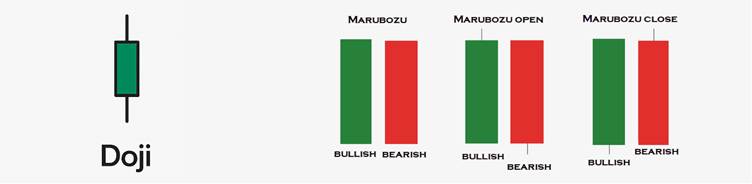
Among dozens of formations, there are a few that are considered the most accurate candlestick patterns because they tell a story of market indecision or absolute dominance. The two most famous are:
- The Indecisive Doji: This is the most honest pattern in the market. A doji candlestick has a very thin body (almost like a plus sign), which means the opening and closing prices were nearly identical. A Doji signals that the market is confused and undecided. If a Doji appears after a long trend, it is a very strong sign that the trend is about to end.
- The Dominant Marubozu: This is a "bald" candle with no wicks at all. A green marubozu candlestick is proof of absolute buyer dominance. Conversely, a red Marubozu signals overwhelming selling pressure with no mercy.
The Key to Success: Always Wait for Confirmation!
This is the most important part of any solid candlestick trading strategies: never open a position based on a single candle alone. A professional trader always waits for candlestick confirmation from the next candle.
For example, after you spot a Hammer pattern (a buy signal), do not immediately hit the Buy button. Wait for the next candle to form. If the next candle is also green and closes higher than the Hammer, then the bullish signal is considered highly valid. Patience to wait for this confirmation is what separates speculation from a mature trading strategy.
Time to Practice Reading the Story
Theory will forever remain theory if it is not put into practice. The best way to train your "eyes" is to observe how these patterns form in a live market.
You can start by opening a demo account at TradingPRO. There, you can mark every Doji, Hammer, or Engulfing pattern you find without any financial risk.
Once you feel more confident, you can move on to our Rookie Account. With a minimum deposit of just $1, you can immediately practice reading the market in a real environment with highly controlled risk.
Open Your Account and Start Learning to Read Candlesticks Now!
Get daily technical analysis and in-depth discussions about price action by joining our official channels:


