




- Published on: 2026-10-06 17:10:26
Identifying Market Structure: A Practical Guide to Reading Price Action

A single candle breaking a swing level doesn’t automatically mean the trend has reversed. Identifying market structure means comparing confirmed swing highs and lows over time, rather than reacting to every sharp move on the chart. That distinction matters when a brief breakout fades or price looks like it’s trending on one timeframe but moving sideways on another.
If swing points feel subjective, you’re not alone. Terms such as break of structure (BOS) and change of character (CHoCH) can add to the confusion because traders don’t always use them the same way. A consistent process makes the chart easier to read without turning any pattern into a guaranteed signal.
This guide explains how to mark relevant swing highs and lows, distinguish trends from ranges, and assess whether a possible directional shift has meaningful confirmation. You’ll also see how BOS and CHoCH fit into the analysis and how to use structure as context alongside a considered risk plan. The goal is a repeatable way to interpret price action, not a promise about what the market will do next.
Key Takeaways
- Read market structure as the relationship between price swings on a chosen timeframe, not as a promise of future direction.
- Use a step-by-step process to identify clear swing highs and lows without labeling every minor fluctuation.
- When identifying market structure, treat BOS and CHoCH as analytical labels, then assess whether a break has meaningful follow-through.
- Start with the broader timeframe before reviewing closer price action, so short-term counter-moves don’t automatically look like reversals.
- Build a consistent chart-review routine by saving examples and recording which swing labels were clear, disputed, or revised.
What identifying market structure means on a price chart
On a price chart, market structure describes how price swings are arranged over a chosen timeframe. Traders compare turning points to assess whether price is advancing, declining, consolidating, or possibly shifting direction. It’s a practical description of what the chart is doing, not a promise about what it will do next.
Market structure is the arrangement of successive price swings on a selected chart timeframe. Keep that definition in view when identifying market structure: the aim is to organize visible price action, not to turn every movement into a prediction or entry signal. A higher high may support a bullish reading, for example, but it doesn’t guarantee that price will continue upward.
The phrase also has a different meaning in economics, where it describes types of competition such as monopoly and oligopoly. The overview of Market Structure in Economics covers that usage. Here, the focus is narrower: the sequence of highs and lows on a trading chart.
What are swing highs and swing lows?
A swing high is a local turning point where price rises and then pulls back. A swing low is a local turning point where price falls and then rebounds. These labels describe visible turns; they don’t automatically mark major resistance or support. A short-lived peak within a broader climb can be a swing high without being a decisive ceiling for price.
Judge each point in context. A turn that stands out on a broad chart may look minor on a closer timeframe, while a small fluctuation may matter briefly on that closer view. The timeframe you choose and the surrounding price action determine how useful a swing is for analysis.
How do higher highs and lower lows describe direction?
Compare each clear swing with the one before it. A sequence of higher highs and higher lows commonly describes upward structure: price reaches higher peaks and holds at higher pullback points. Lower highs and lower lows commonly describe downward structure, as rallies fail below earlier peaks and declines extend to lower points. These patterns characterize direction, but they aren’t standalone instructions to trade.
When highs and lows overlap instead of forming a clear sequence, price may be ranging or its direction may be uncertain. Don’t force a trend label onto a messy chart. Record what the swings show and allow for the structure to become clearer as price develops.
How to identify market structure step by step
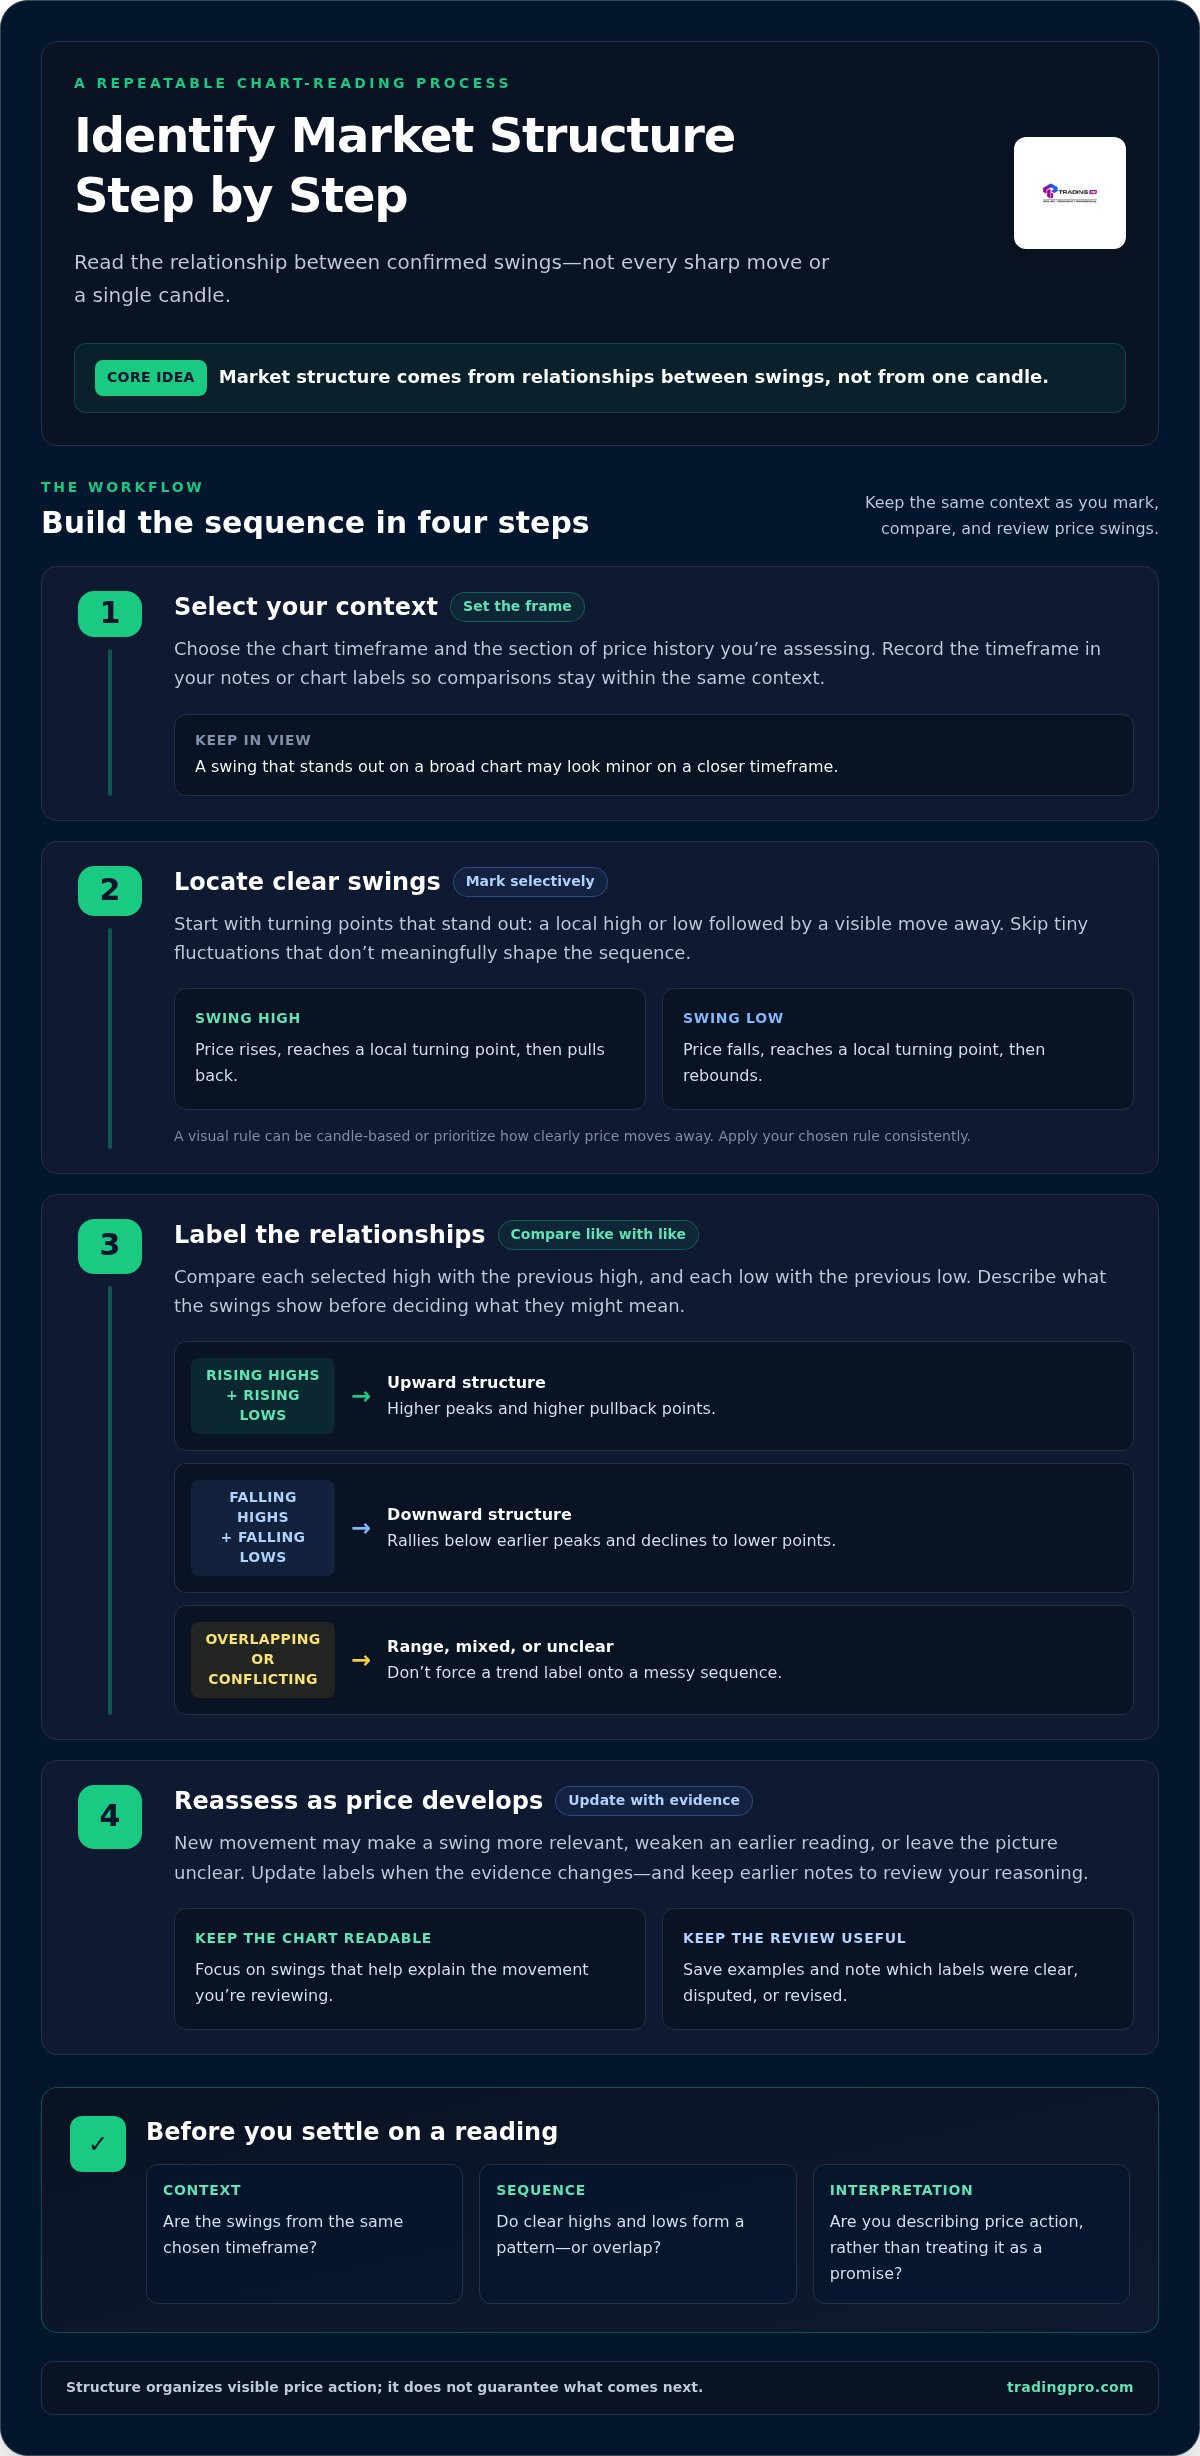
Turn the chart into a sequence you can explain. Apply the same process each time to avoid redrawing the structure around the latest candle. Market structure comes from relationships between swings, not from one candle.
- 1. Select your context. Choose the chart timeframe and the section of price history you’re assessing. Record the timeframe in your notes or chart labels, so later comparisons use the same context rather than mixing swings from different views.
- 2. Locate clear swings. Start with turning points that stand out. Look for a local high or low followed by a visible move away from it. Skip tiny fluctuations that don’t meaningfully shape the sequence.
- 3. Label the relationships. Compare each selected high with the previous high, and each low with the previous low. Note whether they’re rising, falling, overlapping, or mixed. Describe what the chart shows before deciding what it might mean.
- 4. Reassess as price develops. New movement may make a swing more relevant, weaken an earlier reading, or leave the picture unclear. Update your labels when the evidence changes, and keep earlier notes to review your reasoning.
How should you mark meaningful swing points?
Choose a visual rule and apply it consistently. For example, mark a local turning point when price moves away clearly enough to distinguish the reversal from nearby candles. The rule doesn’t need to capture every minor wiggle; it needs to help you identify comparable points across the chart. Some traders use a fixed candle-based rule, while others prioritize how clearly price moves away. Either way, consistency matters more than switching methods to fit each new chart.
Keep your markings selective. A chart crowded with labels can hide the larger sequence. Focus on swings that help explain the movement you’re reviewing.
How do you classify a trend, range, or unclear sequence?
Compare successive highs and lows instead of judging direction from the latest candle. A sustained pattern of rising highs and lows can support an upward classification; falling highs and lows can support a downward one. If price moves between recognizable boundaries without a clear directional sequence, label it a range. If the swings conflict, use “unclear” or “mixed” rather than forcing a trend.
Market structure can also refer to different things in different contexts. The MFA’s fixed-income market structure insights address a different aspect of market structure than chart-based swing analysis. Keep your labels specific to the chart and question you’re evaluating.
Practice this workflow on historical charts before applying it to live decisions. If you’re ready to explore trading, you can find TradingPRO’s account registration page.
Market-structure breaks: confirmation, false breaks, and common confusion
A move beyond a swing point doesn’t prove that price has reversed for good. It may continue the existing direction, signal a possible shift, or quickly fail and return inside the prior range. Treat a break as new information to assess, not a verdict. This distinction is central to identifying market structure without reacting to every brief price excursion.
What is a break of structure, and what can it suggest?
Break of structure (BOS) commonly describes a move beyond a relevant prior swing. What that move suggests depends on the sequence around it. In an established uptrend, a break above a prior swing high may be read as continuation. A break below a significant higher low may raise the possibility of a directional shift. Traders don’t use BOS and change of character (CHoCH) uniformly: CHoCH often refers to an early break against the prior direction, but its exact use varies. Define your terms before applying them, and keep the surrounding swings in view.
A candle that closes beyond a swing shows that price finished the selected interval on the other side of that level. A wick that crosses it but closes back inside shows a temporary excursion within that interval. Neither observation is infallible. A close can still be followed by a failed move, while a wick can precede further movement. Consider what price does next and whether the broader sequence supports your interpretation.
How can you avoid mistaking a false break for a reversal?
Compare the break with the broader swing sequence. For instance, if price has been making higher highs and higher lows, a brief dip below one swing low deserves attention, but it doesn’t by itself establish a lasting downtrend. A close beyond the level, follow-through in the same direction, or a retest that holds may add context. These are observations to weigh, not mandatory confirmation rules. No single method removes uncertainty or guarantees a successful trade.
| Price action | Possible reading | What to assess |
|---|---|---|
| Break in the trend’s direction | Possible continuation | Does the existing swing sequence remain intact? |
| Break against the prior sequence | Possible structural shift | Does follow-through support the change? |
| Move beyond a range boundary | Possible range break | Does price stay outside, or return into the range? |
| Brief wick or conflicting movement | Inconclusive | Wait for more price action before assigning meaning. |
Use labels to describe what you see, not to force a prediction. If a break’s meaning remains uncertain, record it as inconclusive and reassess as the chart develops.
How to use multiple timeframes without mixing market signals
Multiple timeframes can add context, but only if you keep their signals distinct. Start with the chart that best matches the horizon you’re assessing, then move to a closer timeframe for detail. There’s no universal pair of timeframes for every market or method. The aim is a clear hierarchy, not a stack of charts that all demand equal weight.
Which timeframe should you analyze first?
Read the broader context first. Mark its recent swing sequence and note whether it appears directional, range-bound, or mixed. Then inspect a lower timeframe to see how price is moving within that larger picture. For example, a series of falling swings on a closer chart may show a pullback inside a broader uptrend, rather than a confirmed reversal. Treat the shorter-term move as detail until the larger sequence changes.
Choose timeframes that suit the holding horizon and analysis you intend to use. Faster chart horizons can make small movements more prominent. For readers exploring that style, TradingPRO’s trading infrastructure for scalping provides related context.
How can a simple chart-markup routine improve consistency?
Before considering a setup, record what each chart actually shows. Keep the notes brief and separate observations from decisions:
- Broader chart: note the timeframe, recent swing highs and lows, and current structure label.
- Closer chart: record the shorter-term sequence and whether it aligns with or moves against the broader context.
- Uncertainty: write down conflicting signals instead of forcing both charts into one directional conclusion.
- Decision process: assess any setup, entry conditions, and risk controls separately from the structure labels.
This routine makes it easier to compare chart readings without treating every lower-timeframe move as a change in the larger trend. If the broader and closer charts disagree, preserve both observations and wait for clearer context rather than letting the faster chart overwrite the slower one.
For broader trading context, explore TradingPRO’s blog. You can also find TradingPRO’s account registration page when you’re ready to explore trading.
Build a repeatable market-structure routine before you trade
A consistent routine turns chart reading into a skill you can review and refine. Before making live decisions, apply your rules to historical charts, save examples, and compare your first interpretation with what price did afterward. The goal isn’t to prove a label was right. It’s to understand whether your method was clear and applied consistently.
What should a market-structure checklist include?
For each chart, capture the instrument, timeframe, visible swing highs and lows, and your current structural interpretation. Add a note about what could challenge that reading. For example, if you’ve labeled a sequence as upward, identify which swing or price movement would make you reconsider. This helps you avoid recording only evidence that supports your first impression.
Keep the checklist simple enough to repeat:
- Chart context: instrument and timeframe.
- Key points: the swing highs and lows used in your reading.
- Interpretation: trend, range, possible shift, or unclear.
- Counter-evidence: what would weaken or revise that interpretation.
- Review: whether labels stayed clear, were disputed, or needed revision as price developed.
Use the same swing-marking rules across examples. If a label feels uncertain, note the uncertainty instead of changing your criteria to make the chart fit a preferred conclusion. Over time, saved charts can reveal where your process is consistent and where your judgments need refinement.
How can beginners turn chart practice into a learning process?
Practice one chart at a time. Mark the swings, write your interpretation, and return later to see whether new price action supported or challenged it. Keep this analysis separate from any trade decision: identifying market structure is only one input. Entry conditions, position sizing, and risk management require their own considered plan, and no chart label removes trading risk.
TradingPRO’s Rookie Account is one of its account options for traders exploring a starting point. You can read about registration on the TradingPRO account registration page.
Register with TradingPRO when you’re ready to explore trading.
Put your chart-reading process into practice
Strong structure analysis starts with a clear method. Mark meaningful swings on a chosen timeframe, compare their relationships, and reassess as price develops. A move beyond one swing point may offer useful information, but it doesn’t confirm a lasting reversal on its own.
Keep the bigger picture and shorter-term movement distinct. Save chart examples, record what supports or challenges your interpretation, and treat structure as context rather than a signal by itself. Entry decisions, position sizing, and risk management still need careful consideration.
TradingPRO offers Rookie, Micro, Pro, and Scalp account tiers, as well as Social Trading and Copy Trading within its trading ecosystem. When you’re ready to explore these trading options, create your TradingPRO account. Keep practicing identifying market structure, stay deliberate with your analysis, and build confidence through a consistent process.
Frequently Asked Questions
What is market structure in trading?
Market structure in trading describes the sequence and relationship of price swings on a selected chart timeframe. Traders compare highs and lows to assess directional movement, consolidation, or a possible change in direction. For example, rising swing highs and lows can indicate upward structure. This chart-based meaning differs from economic market structure, which describes industry competition. Price structure provides context for analysis, not a prediction or guaranteed signal.
How do you identify market structure for beginners?
Start by choosing one chart timeframe, then mark only clear turning points rather than every small fluctuation. Compare each swing high and low with the one before it. A sequence of rising highs and lows may suggest upward structure; falling highs and lows may suggest downward structure. If the swings overlap or conflict, label the chart as ranging or unclear. Apply the same marking approach consistently and record your chosen timeframe.
What is the difference between a break of structure and a change of character?
A break of structure (BOS) commonly describes price moving beyond a relevant prior swing. Traders may use it to describe continuation or a potential directional change, depending on the preceding swings. Change of character (CHoCH) often refers to an early break against the existing sequence. These terms don’t have one universal definition, so clarify how you use them. Neither label alone confirms that a lasting reversal has occurred.
Can market structure predict where price will go next?
No. Market structure can help describe current price behavior and frame possible scenarios, but it can’t reliably tell you exactly where price will go next. A higher high may support a bullish reading, yet price can still turn lower; a break below a swing low may fail to continue. Treat structure as one input in analysis. Consider uncertainty, entry conditions, position sizing, and risk management separately.
How do you identify a trend reversal using market structure?
Look for a change in the swing sequence, not just one move against the trend. In an uptrend, a break below a relevant higher low may raise the possibility of a reversal. The case may gain context if price then forms a lower high and continues lower. These developments don’t guarantee a trend change. Compare the new swings with the broader timeframe and revise your interpretation as price action evolves.
Does market structure work on every timeframe?
Price swings can be analyzed on different timeframes, but the structure you see depends on the chart scale. A short-term chart may show a decline while a broader chart still shows an uptrend. Choose a timeframe that fits the analysis you’re doing, record it, and keep observations from different charts distinct. Use the broader view for context before examining lower-timeframe detail, and avoid assuming one timeframe combination fits every market or approach.
What is a false break in market structure?
A false break is a move beyond a swing level or range boundary that doesn’t develop into sustained movement in that direction. For instance, price may wick above a prior high, then close back below it or return inside the range. A close beyond the level can also fail afterward. Look at follow-through and the broader swing sequence for context. No single test can remove uncertainty or guarantee that a break will hold.


