




- Published on: 2026-10-06 17:10:49
How to Draw Trend Lines Correctly: A Practical 5-Step Guide

A trend line that needs constant adjusting may be revealing your bias, not the market’s direction. Learning how to draw trend lines correctly starts with a simple rule: follow visible price structure, not the trade you hope to make. It’s easy to second-guess which highs or lows to connect, or to switch between candle wicks and closes until a line looks convincing. A repeatable process helps you avoid that trap.
You’ll learn to identify the right swing points, draw an uptrend line through higher lows or a downtrend line through lower highs, and apply one consistent anchor method. Two points can suggest a line; a third touch adds context, but it doesn’t guarantee the line will hold. This five-step guide also explains how to assess a line across timeframes, spot weak or broken support and resistance, and decide when a line has outlived its usefulness. Use trend lines as chart context, not standalone trading signals, and let price action challenge your analysis rather than bending the chart to fit it.
Key Takeaways
- Learn how to draw trend lines correctly with a consistent five-step process, from choosing a timeframe to selecting clear swing points.
- Compare a line anchored to meaningful price structure with one adjusted to fit a preferred trade.
- Check anchor clarity, intervening price action, timeframe, and drawing consistency before relying on a trend line.
- Use trend lines alongside market structure and a defined trading plan, not as automatic entry or exit signals.
- Practise on historical charts and record your choices in a journal to build a more consistent charting routine.
What a Trend Line Shows, and What It Cannot Tell You
A trend line is a visual guide drawn through meaningful swing points to make the direction and rhythm of price action easier to read. It can help you see whether pullbacks are finding support at progressively higher levels or rallies are stalling at progressively lower ones. It doesn’t explain why price is moving, and it can’t guarantee what happens next.
A trend line shows how selected swing points align; it cannot prove that the trend will continue, reverse, or produce a trading opportunity. That distinction is central to learning how to draw trend lines correctly: use the line to describe what the chart shows, not to make the chart confirm a preferred view. For a broader overview of trend lines in technical analysis, see Trend line (technical analysis).
How rising lows and falling highs reveal market structure
In an upward structure, price advances, pulls back, then forms a swing low above the previous meaningful low. An ascending trend line connects those rising lows. In a downward structure, price declines, rebounds, then forms a swing high below the previous meaningful high. A descending line connects those falling highs.
For example, imagine a chart where each pullback bottoms higher than the last. A rising line beneath those lows makes the pattern easier to see. It doesn’t mean every dip must stop at the line. The line simply summarizes the structure visible so far.
Why a trend line is a guide, not a prediction
A trend line differs from horizontal support or resistance. Horizontal levels mark areas where price has turned or stalled around a similar price; a trend line slopes to connect swing points that change over time. Both help organize a chart, but neither is a barrier price must respect.
Price can move through a line briefly, or break it and continue without a lasting reversal. A touch or break is an observation, not an entry or exit decision. Before acting, consider the broader price structure and your risk plan. Treat the line as one piece of context, then check whether the rest of your analysis supports a trade.
How to Draw Trend Lines Correctly in Five Repeatable Steps
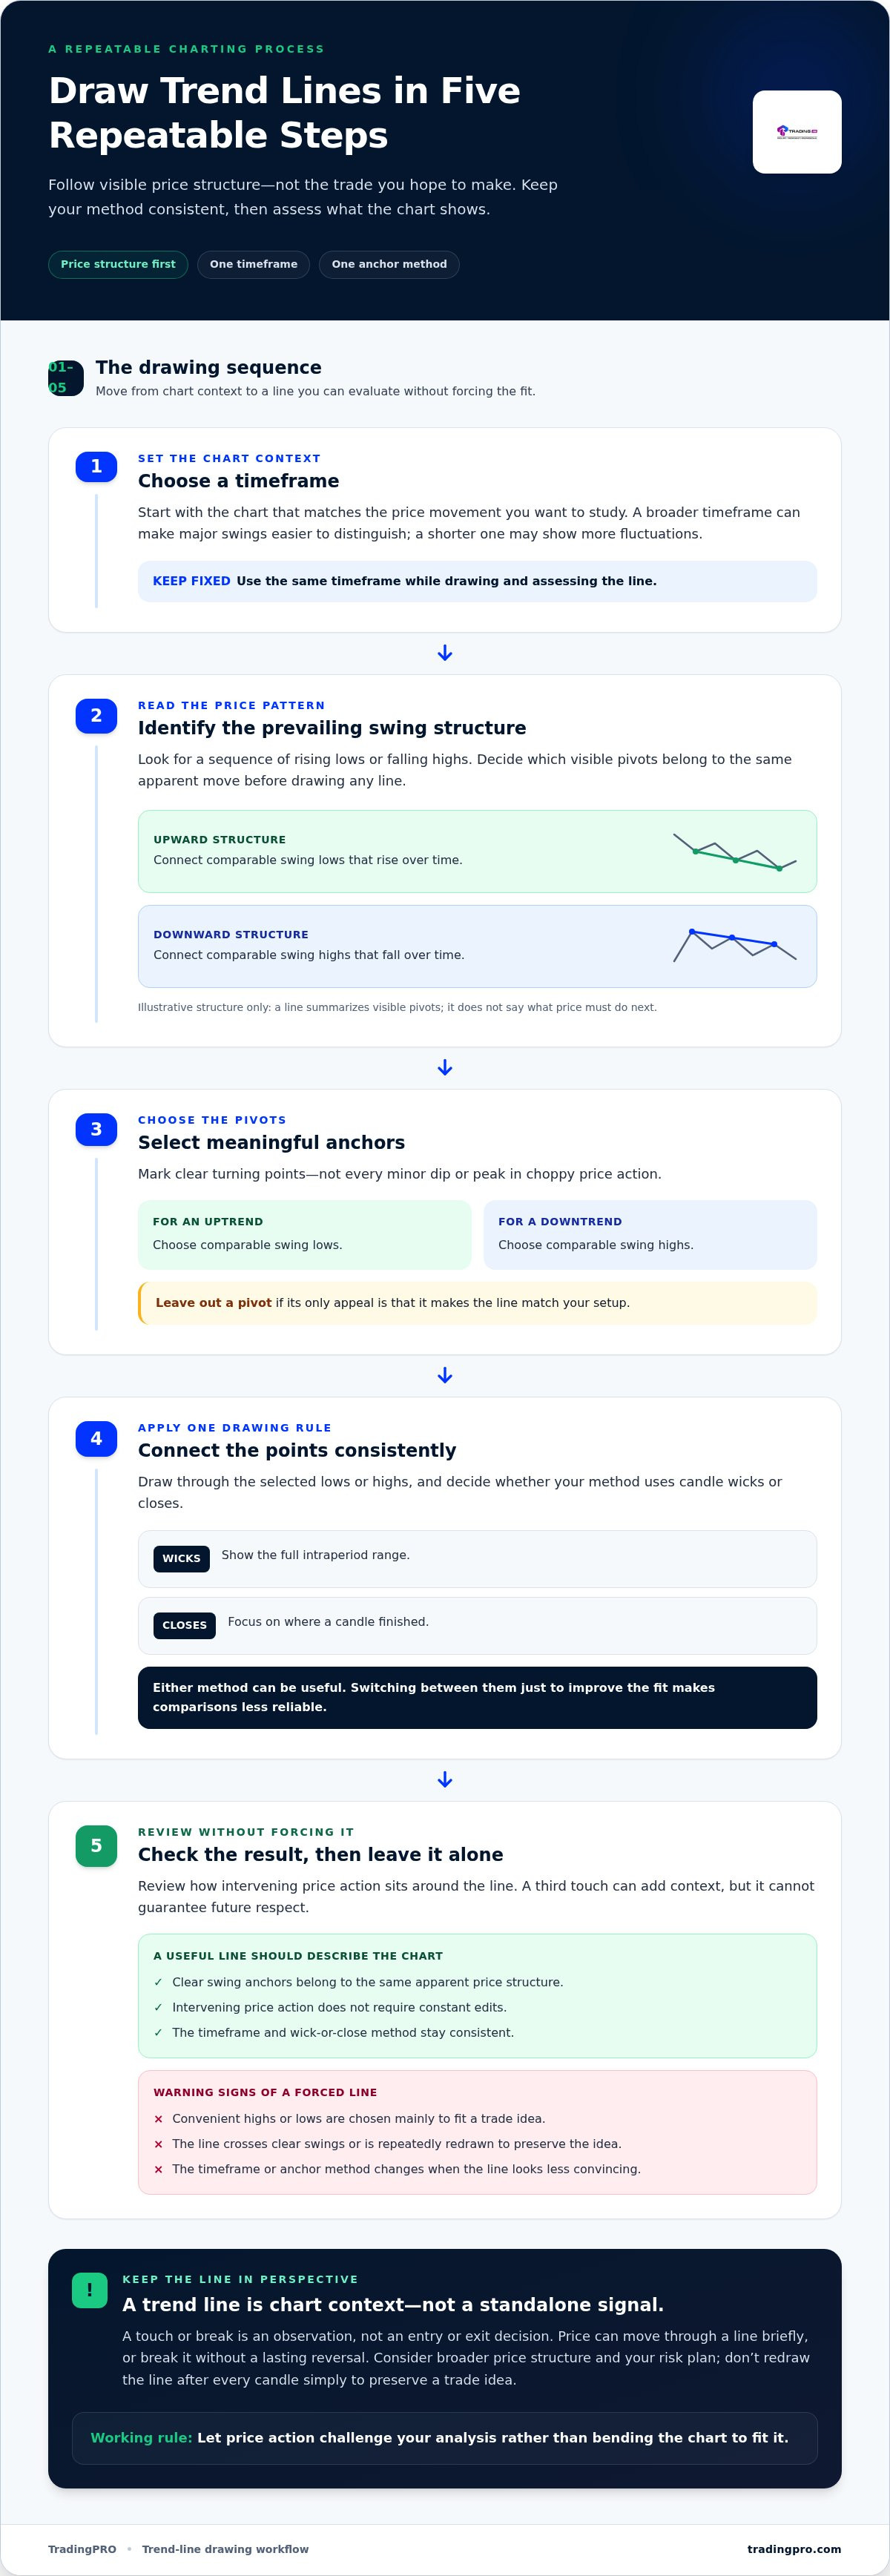
Use the same sequence on every chart. It helps distinguish a line that reflects price structure from one adjusted to support a preferred trade. Fidelity’s guide to basic concepts of trend lines also explains how trend lines connect swing points and can help frame support or resistance.
- Choose a timeframe. Start with the chart that matches the price movement you want to study. A broader timeframe can make major swings easier to distinguish; a shorter one may show more fluctuations. Keep the timeframe fixed while drawing and assessing the line.
- Identify the prevailing swing structure. Look for a sequence of rising lows or falling highs. Don’t begin by drawing a line and searching for points to fit it. First decide which visible pivots belong to the same apparent move.
- Select meaningful anchors. Mark clear turning points, not every minor dip or peak in choppy price action. In an uptrend, choose comparable swing lows; in a downtrend, choose comparable swing highs. Leave out a pivot if its only appeal is that it makes the line match your setup.
- Connect the points consistently. Draw through the selected lows or highs and decide whether your method uses candle wicks or closes. Wicks show the full intraperiod range; closes focus on where a candle finished. Either method can be useful, but switching between them to improve the fit makes comparisons less reliable.
- Check the result, then leave it alone. Review how intervening price action sits around the line. A third touch can add evidence that the line is meaningful, but it can’t guarantee future respect. Treat the drawing as a working reference, not a boundary price must obey. Don’t redraw it after every candle simply to preserve a trade idea.
This repeatable method is the practical core of how to draw trend lines correctly: choose the timeframe, read the structure, select comparable pivots, apply one anchor rule, then assess the line without forcing it. Record your choices so you can compare charts consistently. To put your chart-reading routine into practice, register for a TradingPRO Rookie Account.
How to Validate a Trend Line and Avoid Misleading Chart Lines
A line can look precise and still tell you little if its anchors were chosen to fit a trade idea. Validate it against the chart, not against your preferred outcome. This is a practical part of learning how to draw trend lines correctly: test whether the line describes visible structure before using it as context.
| Structurally anchored line | Forced line |
|---|---|
| Connects clear swing points that belong to the same price structure. | Uses convenient highs or lows simply because they make the line fit. |
| Accounts for intervening price action without needing constant edits. | Crosses through swings or gets redrawn repeatedly to preserve the idea. |
| Is assessed on a stated timeframe with a consistent wick or close method. | Changes timeframe or anchor method whenever the line looks less convincing. |
What makes a trend line more useful for analysis?
Start with anchor clarity. Can you point to distinct swing highs or lows, rather than small fluctuations inside choppy price action? Then inspect the candles between the anchors. If the line only appears valid when you ignore several clear moves through it, it may not describe the structure well.
Timeframe matters, too. A line on a short-term chart describes that chart’s swings; it shouldn’t automatically be treated as a major market level. Note the timeframe and keep your anchor method consistent. Additional interactions with a line can strengthen the observation that price has responded around that area, but they don’t prove it will happen again.
When to keep, adjust, or discard a line
Keep the line while it remains a clear, useful summary of the structure you selected. If later price action creates a new swing that changes that structure, you may adjust the drawing. Make the change because the chart has changed, and record which new pivot prompted it.
Discard a line if it needs repeated subjective edits to stay aligned. Confirmation bias can make this difficult: once you expect support or resistance at a particular slope, it’s tempting to move an anchor until the chart seems to agree. Pause and assess the line using the same criteria you’d apply to any chart.
No number of touches, steepness, or visual neatness guarantees future price behavior. A break may challenge the line without confirming a lasting reversal, just as another touch doesn’t promise a bounce. Treat each interaction as information to assess alongside the broader price structure and your trading plan.
How to Use a Trend Line Without Treating It as a Trade Signal
A trend line can help you interpret price structure, but it can’t decide whether a trade fits your plan. A touch may simply show price reaching the line. A move through it may be temporary. Keep observation, trade criteria, execution, and risk controls separate so one chart drawing doesn’t drive the whole decision.
Combine trend-line context with a complete trading plan
Before acting, use this checklist to put the line in context:
- Observation: What does the line describe, and on which timeframe? Compare it with the broader swing structure instead of reading it in isolation.
- Setup criteria: What additional evidence would make a potential setup relevant to your approach? Define that evidence in advance, rather than deciding after price reaches the line.
- Execution: What conditions would need to be present before you consider entering or exiting? A line alone doesn’t supply those conditions.
- Risk controls: Where would your analysis be invalidated, and how would you manage the risk if the idea doesn’t work? Set these boundaries before acting.
Timeframe can change what a line means. A trend line on a short-term chart reflects shorter-term price movement, while a broader chart may show a different structure. If you’re building your foundation, TradingPRO’s forex trading for beginners guide offers additional context for approaching the market with a plan.
Respond to a touch or break with discipline
A touch, rejection, or apparent break is a prompt to assess the chart, not an instruction to trade. A candle may briefly cross a line and then move back; price may also pass through it without immediately establishing a lasting reversal. Neither event has a universal meaning across markets and timeframes.
Decide beforehand what evidence you’ll look for next, such as whether the broader structure remains intact or whether your predefined setup conditions have appeared. If that evidence isn’t there, waiting is a valid choice. This is a practical extension of how to draw trend lines correctly: use the line to organize your analysis, then let your plan guide any decision.
Technical analysis can help structure a view, but it can’t remove uncertainty or guarantee an outcome. Build your chart routine around deliberate decisions, not reflexive responses to every price movement. When you’re ready to put that process into practice, register for a TradingPRO Rookie Account.
Practise Trend-Line Drawing and Build a Consistent Routine
Test a new drawing method on historical charts before using it to inform live decisions. Past price action lets you pause, mark swing structure, and see whether your anchor choices stay consistent as the chart unfolds. The goal isn’t to find a line that would have made a trade work. It’s to apply the same rules and assess what they show.
A simple routine for reviewing trend-line decisions
Use a chart journal to preserve your original reasoning. For each review, follow the same sequence:
- Select a chart and timeframe. Mark the visible swing structure before drawing any line.
- Record your anchors. Note the highs or lows you chose, whether you used wicks or closes, and why those points belong to the same structure.
- Write down your interpretation. State what the line helps you observe and what price action would invalidate that view.
- Review later movement. Compare subsequent price action with your notes. Don’t edit the original rationale to make it fit the outcome.
Judge the routine by its consistency, not by whether one chart moved as expected. A line can be drawn methodically and still fail to describe what price does next. That’s useful information: review whether your anchors were clear and your rules were applied evenly, then make any changes explicit before analysing another chart.
From chart study to your next trading step
TradingPRO offers Rookie, Micro, Pro, and Scalp accounts, along with social and copy trading. Keep your learning process grounded in your journal and risk plan. Knowing how to draw trend lines correctly can sharpen chart observations, but it can’t remove market uncertainty or guarantee an outcome.
If you’re beginning your trading journey, a Rookie Account is one way to take your next step. Practise your chart routine and think through the risks involved as you build your approach. Register for a TradingPRO Rookie Account.
Make Your Charting Process Consistent
Strong trend-line analysis starts with a repeatable method, not a line that looks persuasive after several edits. Choose clear swing points, use a consistent timeframe and anchor approach, then check whether the line still reflects the chart as price develops. A third touch may add context, but no line can guarantee what comes next.
Practise on historical charts and record your anchors, reasoning, and later observations. This builds a clearer view of how to draw trend lines correctly while keeping each line in its proper role: one input alongside market structure, a defined plan, and risk controls. Review your decisions for consistency, not just whether an individual trade worked out.
TradingPRO offers Rookie, Micro, Pro, and Scalp account tiers, along with social and copy trading. Register for a TradingPRO Rookie Account and continue building your trading knowledge with a disciplined approach. Keep practising, stay objective, and let your process guide your decisions.
Frequently Asked Questions
How do you draw a trend line correctly?
Start by identifying the prevailing swing structure, then connect meaningful lows in an uptrend or meaningful highs in a downtrend. To understand how to draw trend lines correctly, use a consistent timeframe and the same anchor rule, whether you select wicks or candle closes. Check how intervening price action relates to the line without repeatedly adjusting it to fit your view. Treat it as chart context, not a standalone prediction or trade signal, and review your reasoning later.
How many points do you need to draw a trend line?
Two meaningful swing points are enough to plot a trend line, but they don’t prove it will remain relevant. A later interaction adds context, not certainty. For example, if price returns to an ascending line after forming another higher low, note that interaction and assess the surrounding structure. Focus on whether the selected pivots are clear and consistent, and whether the line describes price action between them without forcing a fit.
Should trend lines use candle wicks or closing prices?
Either wicks or closing prices can be useful, depending on the structure you’re analysing. Wicks show the full high-to-low range reached during a candle, while the close shows where that candle finished. Choose the method that suits your chart-reading approach and apply it consistently. If a line only looks convincing after switching from wicks to closes, pause and reassess the anchors instead of changing the rule to support a preferred interpretation.
Can a trend line predict where price will go next?
No. A trend line summarizes visible price structure; it can’t guarantee future direction, a reversal, or a reaction at a particular level. A touch may not lead to a bounce, and a break alone doesn’t establish a lasting reversal. Assess either event alongside broader price context and a predefined risk plan. Trend lines are one analytical reference, not a forecast. Markets remain uncertain, even when a line appears clear and well supported.
What timeframe is best for drawing trend lines?
There’s no single best timeframe for every trader or analysis. Choose one that matches the price movement you want to study, then connect swing points that belong to that structure. For instance, don’t mix a small fluctuation from a short-term chart with a major swing from a broader chart. A line can look different across timeframes, so note which chart you used and interpret the drawing within that timeframe.
When should you redraw or remove a trend line?
Reassess a trend line when new price action changes the structure it was meant to describe, or when it no longer provides useful context. If you adjust or remove it, record why, such as a new swing point changing the pattern. Avoid repeatedly moving anchors to preserve a trade idea. That habit can make a subjective line seem more convincing than the chart evidence supports. Keep the original reasoning available for later review.


