




- Published on: 2026-10-07 07:53:41
How to Avoid False Breakouts: A Practical Trading Checklist

A price crossing a visible level can look like a clear entry, right up until it reverses. That frustrating whipsaw is why learning how to avoid false breakouts takes more than spotting a line on a chart. A brief move beyond resistance or support may lack the strength to hold, and no single candle, volume spike, or indicator can guarantee what happens next.
If you’ve entered on the first push through a level, only to watch price fall back into its range, the answer isn’t finding a perfect signal. It’s following a repeatable decision process. This guide explains how to assess whether a breakout has a stronger case to hold, while defining your risk if it fails.
Use three checks: wait for price confirmation, read the move in its broader market context, and set an invalidation point before entering. You’ll also learn how to weigh candle closes, volume, and momentum without treating any one measure as decisive. The goal isn’t to eliminate false breakouts. It’s to make disciplined choices when the evidence is mixed.
Key Takeaways
- Recognize a possible false breakout by tracking whether price can hold beyond a watched level. Remember that failure is clearer in hindsight than in real time.
- Compare candle closes, retests, volume, and indicator signals as useful clues, not pass-or-fail tests.
- Use a step-by-step entry plan that sets an invalidation point and acceptable risk before you decide to trade.
- To learn how to avoid false breakouts, build a consistent routine for reviewing setups and recording outcomes.
- Practice on historical charts or in a demo environment before putting capital at risk.
What Is a False Breakout, and Why Does Price Reverse?
A false breakout occurs when price moves beyond a watched support or resistance level, then fails to hold on the other side and returns to the prior range. The move may look convincing as it unfolds, but whether it has truly failed is usually clearer in hindsight. In real time, traders work with uncertainty, not a guarantee.
A breach can trigger breakout entries and stop orders clustered near a level. That burst of activity may briefly push price beyond it, but momentum can fade if fresh buying or selling doesn’t follow. Liquidity can also shift as participants enter or pull orders. Scheduled news may sharply change volatility and disrupt a setup that looked plausible moments earlier. A foundational overview of how price moves through chart levels appears in Breakout (technical analysis).
A brief breach shows that price crossed a level; sustained acceptance beyond it shows that the market is holding there. That distinction is central to how to avoid false breakouts: assess what price does after crossing, rather than treating the first move through a line as proof.
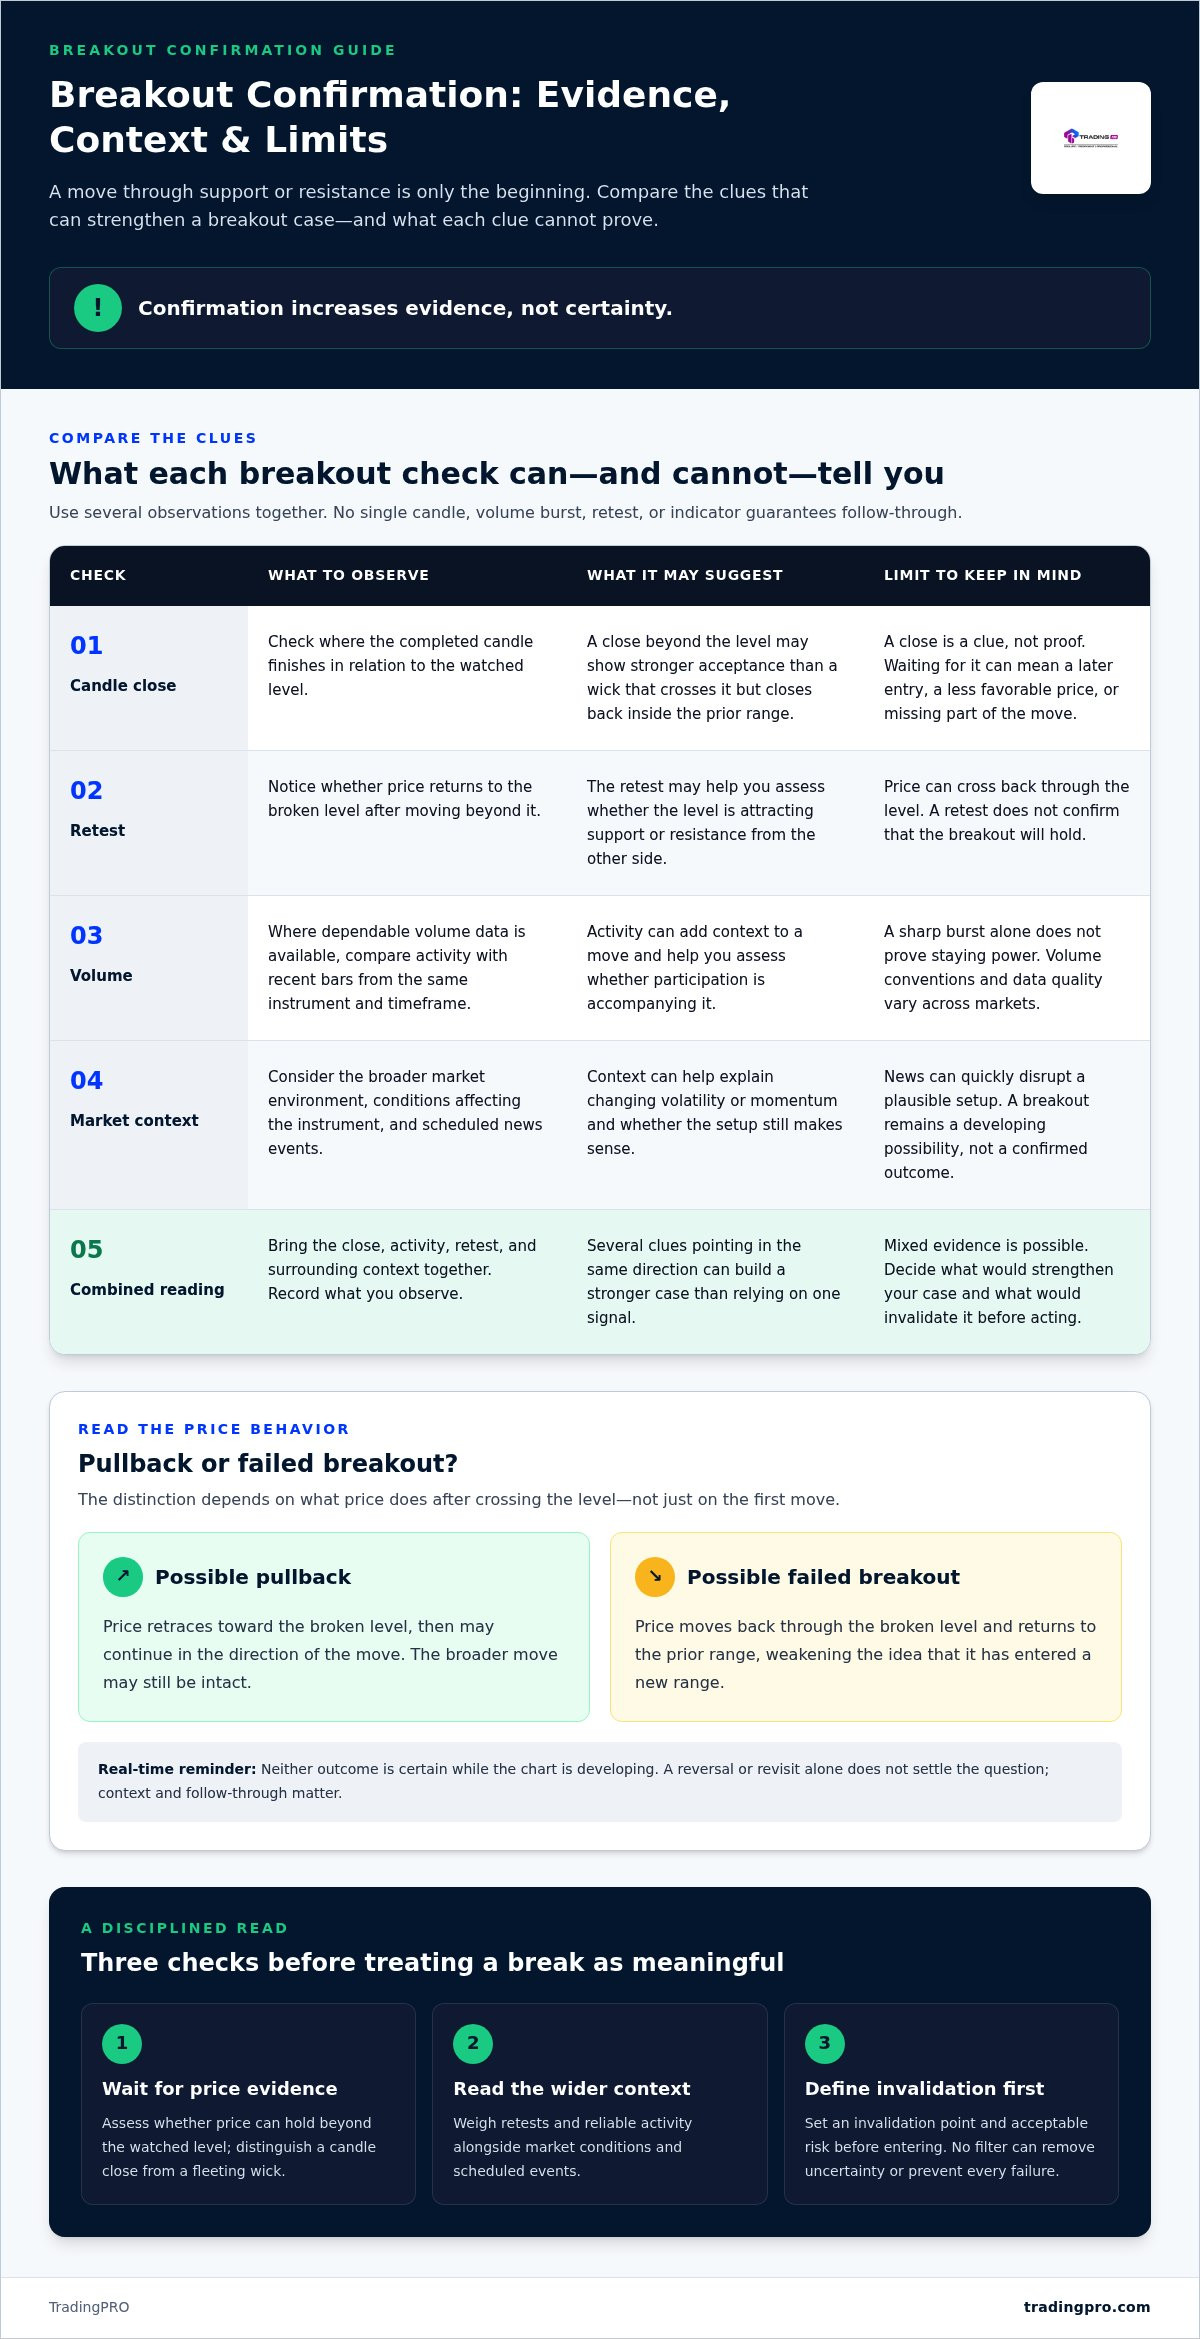
How does a false breakout differ from a pullback?
A pullback is a temporary retracement within a move that may still be intact. After breaking above resistance, for example, price might dip toward that level and then continue higher. A failed breakout instead returns through the broken level, weakening the idea that price has moved into a new range. One reversal alone doesn’t settle the question. Context and follow-through matter.
Imagine a price area that has repeatedly acted as resistance. Price moves above it, then slips back below and remains inside the earlier range. That behavior may point to a failed break. If price only revisits the area before moving above it again, the dip may be a pullback instead. Neither outcome is certain while the chart is developing.
Why can price break a level and then reverse?
Visible support and resistance levels attract attention, but they don’t dictate a one-way move. Orders may cluster around them, making a brief crossing enough to trigger entries or stops. If fresh participation doesn’t sustain the move, price can lose momentum and reverse. A sharp volume burst alone doesn’t prove the breakout has staying power.
Scheduled news can add another layer of uncertainty. A release may quickly change volatility, widen price swings, or redirect momentum, making an otherwise reasonable setup fail. Include the event calendar in your market context, and treat any breakout as a developing possibility rather than a confirmed outcome.
How to Confirm a Breakout With Price, Volume, and Context
Judge a breakout by the evidence around it, not by a single indicator or a rigid pass-or-fail rule. A candle close, trading activity, a retest, and the broader market environment each add information, but none can tell you with certainty what price will do next. Ask whether several clues support the same reading and whether your plan still makes sense if they don’t.
Confirmation increases evidence, not certainty. Keep that principle in view as you assess how to avoid false breakouts. A setup can look convincing and still fail, so decide what would strengthen your case and what would invalidate it before acting.
What does a candle close beyond support or resistance tell you?
A completed candle shows where price finished for that interval, offering more information than a brief move that disappears before the candle closes. A candle that closes beyond a level may suggest stronger acceptance than a wick that extends past it and finishes back within the prior range. It’s a clue to weigh, not a guarantee.
Choose a candle timeframe that fits your trading plan, and distinguish it from your intended holding period. Waiting for a close can help you avoid reacting to a fleeting spike, but it may also mean entering at a less favorable price or missing part of the move. Apply the same rule consistently so you can assess its trade-offs.
How do volume, retests, and news add context?
Compare activity with a relevant baseline when the instrument provides dependable volume data. For example, assess a current bar against recent bars from the same instrument and timeframe. Volume conventions and data quality vary across markets, so don’t assume a spike means the same thing everywhere.
A retest, where price returns to the broken level, may show whether that area is attracting support or resistance from the other side. It isn’t proof: price can cross back through it. Check scheduled events and conditions affecting the instrument before interpreting a sudden move, since news can shift volatility and change the setup’s context.
Bring the clues together: note the close, compare activity where reliable, and consider whether a retest or event changes your interpretation. Record what you observe rather than adding filters after the fact. If you’re building a structured trading routine, the TradingPRO account registration page is available alongside your research.
Can You Avoid Every False Breakout? Common Filters and Their Limits
No. A filter can help you assess a breakout, but none can prevent every failure or remove uncertainty. Each asks a different question: did price hold beyond the level, did activity support the move, or does the market context fit your setup? Use filters to shape a decision, not to promise an outcome.
Which breakout filters can help, and what can they miss?
Candle closes and retests are price-action clues with different timing trade-offs. A close beyond a level may help screen out brief intrabar moves, but waiting can mean a later entry. A retest may offer another chance to assess the level, yet price can reverse before reaching it or fail after appearing to hold. Volume and volatility measures add context, but their usefulness depends on the instrument, timeframe, and quality of available data.
| Clue | What it may show | Its limitation |
|---|---|---|
| Candle close | Price finished the candle beyond the watched level. | Price can still return through the level, and waiting may sacrifice an earlier entry. |
| Retest | The broken level is being tested from the other side. | A test can fail, and price may not retest before moving. |
| Volume context | Trading activity differs from a relevant baseline. | Volume data and meaning vary across markets; unusual activity alone doesn't confirm direction. |
| Indicator filter | A price-derived measure aligns with or diverges from the move. | It may lag, conflict with other clues, or repeat information already visible in price. |
Choose the trade-off deliberately. Entering earlier may capture more of a move but leaves less confirmation. Waiting for additional evidence may make the setup fit your rules better, while increasing the chance of a worse entry or a missed move. The best filter is the one you can apply consistently within a written plan, not the one that looks strongest after the chart has played out.
Why can too many indicators create false confidence?
Many indicators are calculated from the same underlying price data, so stacking them doesn’t necessarily provide independent confirmation. A moving average, momentum measure, and oscillator might all reflect the same recent rise. If they disagree, adding more tools can delay a decision without resolving the uncertainty.
Keep your checklist short. Define the level, the price behavior you want to see, any relevant context, and what would invalidate the setup. That structure is a more practical answer to how to avoid false breakouts than collecting signals until they seem unanimous. Test the same rules across examples before changing them.
How to Trade a Breakout With a Clear Entry and Invalidation Plan
A breakout plan should answer three questions before you enter: what needs to happen, what proves the idea wrong, and how much risk you’re willing to take. This structure won’t eliminate losing trades. It gives you a defined response instead of forcing decisions under pressure.
Invalidation is the condition that shows your original trade idea no longer applies. Set it before entry. Don’t move it simply because price is approaching it.
What should a pre-trade breakout checklist include?
Use the same chart timeframe and level-marking method from setup to setup. A level matters because price has reacted around it before, not because a line on a chart guarantees a future response. Then work through this sequence:
1. Mark the level. Record the support or resistance area and the timeframe behind it. Avoid shifting the level to fit price after the move begins.
2. Define the entry condition. Specify what you need to see, such as a candle close beyond the level or a planned retest. Note whether follow-through supports your setup, and consider volume only where the data is meaningful for that instrument.
3. Check the context. Review relevant scheduled events and market conditions that could affect volatility. A sudden move near an event may behave differently from a quieter setup.
4. Set invalidation and risk. Choose the price or market behavior that would disprove the idea. Decide your maximum planned risk and calculate position size from that limit and the distance to your exit point. If the setup requires more risk than your limit allows, skip it.
5. Plan for execution. A stop helps define an exit, but it may not fill at the exact stop price. Volatility, slippage, and execution conditions can affect the result, so account for that possibility when setting size and risk.
How should you review a breakout that fails?
Follow the exit plan if invalidation occurs. Moving a stop farther away just to avoid accepting a loss changes the original risk and weakens the process. Once the trade is closed, record the level, entry condition, evidence, planned risk, execution, and result in a journal.
Review a meaningful sample of trades before changing a rule or adding another indicator. One failed setup doesn’t prove the checklist is broken; one winning trade doesn’t prove it works. Look for repeated patterns, then make one deliberate adjustment and track it consistently. That’s a practical way to improve how to avoid false breakouts without chasing a perfect signal.
Keep your written plan at the center of your process. TradingPRO account registration is available at this link as you continue developing and reviewing your approach.
Build a Repeatable Breakout Routine Before You Trade Live
A reliable routine turns breakout analysis into a process you can review, not a search for a perfect signal. Observe setups, document what you see, test the same rules consistently, then assess the evidence. Practice on historical charts or in a demo environment before risking capital. Tools and accounts can support your process, but they can’t remove market risk.
How can you test a breakout checklist without rushing?
Keep the test controlled. Choose one market, one timeframe, and one written set of rules for a defined review period. Changing several variables at once makes it harder to understand what the results actually show. For each potential setup, record whether it met your entry conditions, what happened around the level, and whether you took a trade.
Log failed setups and no-trade decisions too. They help reveal whether your rules were applied consistently, including when a tempting move didn’t meet your criteria. Review two things separately:
- Process: Did you follow the entry, invalidation, and risk rules you set?
- Outcome: Did the trade make or lose money?
A disciplined trade can still lose, and a trade that breaks your rules can still win. Assess a meaningful body of observations before deciding whether the checklist needs revision. That’s a measured way to evaluate how to avoid false breakouts without reacting to one memorable chart.
What is a sensible next step for a new trader?
Build your market foundations before moving from observation to live trading. Review core concepts such as price movement, support and resistance, volatility, and risk. A Forex Trading for Beginners Guide can help you strengthen that groundwork alongside practice. Keep your routine simple, and make sure you understand the risks before committing capital.
TradingPRO offers a Rookie Account as one account pathway for beginners to explore while they continue learning. It doesn’t make breakout signals more reliable or remove the possibility of loss. Progress in stages: study, observe, test your written process, and decide whether you’re ready for the next step.
TradingPRO registration is available at this page for readers ready to explore an account after considering the risks.
Trade the Setup, Not the First Price Spike
A disciplined breakout decision rests on more than a level crossing. Wait for price evidence, weigh volume and market context as clues, and decide in advance where the trade idea is invalidated and how much you’re prepared to risk. No filter can remove uncertainty, but a written process can help you respond consistently when a setup fails.
The practical answer to how to avoid false breakouts isn’t finding a perfect signal. It’s testing a clear checklist, recording both trades and no-trade decisions, and reviewing your execution separately from each outcome. Build experience with historical charts or a demo environment before putting capital at risk.
TradingPRO offers Rookie, Micro, Pro, and Scalp account tiers, along with Social Trading and Copy Trading. These are account and trading options, not protection from market losses or false breakouts. When you’re ready to explore an account, create your TradingPRO account.
Stay consistent, keep learning, and let your rules guide the next decision.
Frequently Asked Questions
What is a false breakout?
A false breakout is a move beyond a watched support or resistance level that fails to hold and returns to the prior range. For example, price may rise above resistance briefly, then fall back below it. The failure is easier to identify after the reversal; while price is moving, a trader can only assess the available clues and manage uncertainty.
How can I tell if a breakout is real or false?
You can’t know with certainty as a breakout develops, but you can assess whether evidence supports it. Check whether a candle closes beyond the level, whether price follows through, and whether activity and market context fit your written plan. A wick that quickly returns inside the range may signal weak acceptance. Treat each clue as evidence, not proof, and define invalidation before entry.
Should I wait for a candle to close before trading a breakout?
Waiting for a candle close can help you avoid reacting to a brief price spike, because the close shows where price finished for that interval. It may also mean entering later or missing part of a fast move. Choose a timeframe that fits your trading plan, then apply the rule consistently. A close beyond the level is useful confirmation, not a guarantee that price will stay there.
Does high volume confirm a breakout?
High volume can add context, but it doesn’t confirm a breakout on its own. Compare activity with a relevant baseline for the same instrument and timeframe, where dependable volume data is available. Market structure and volume reporting differ, so a spike may not carry the same meaning across markets. Consider whether price holds beyond the level and whether other evidence aligns before making a decision.
Can a retest fail after a breakout?
Yes. A retest is a possible check of the broken level, not proof that the breakout is valid. After price moves above resistance, it may return to that area and hold, or it may fall back through and weaken the setup. Price can also continue without a retest. Decide in advance what behavior would support your plan and what would invalidate it.
Which indicators are best for avoiding false breakouts?
No indicator is best for every market or setup, and none reliably removes false breakouts. Moving averages, momentum indicators, and volume-based tools can offer context, but they may lag or reflect information already present in price. Keep your checklist focused: use indicators only when they answer a specific question in your written plan. Test their role consistently instead of adding signals to seek certainty.
What should I do after entering a false breakout?
Follow your predefined exit plan if the trade reaches its invalidation point. Don’t move a stop farther away just to avoid accepting a loss; that changes the risk you planned. After the trade closes, record the setup, evidence, execution, and outcome. Review your process across a meaningful sample of trades before changing a rule. A single loss doesn’t show whether the overall method is sound.


